Osu! is a popular PC game where players use their mouse and keyboard to click circles and slide sliders in rhythm to a song. The game has nearly 13 million registered users and was the #20 most played PC game last month (August 2018) according to newzoo. Pretty impressive considering it's open source!
Levels in Osu! are called beatmaps. Here's what they look like:
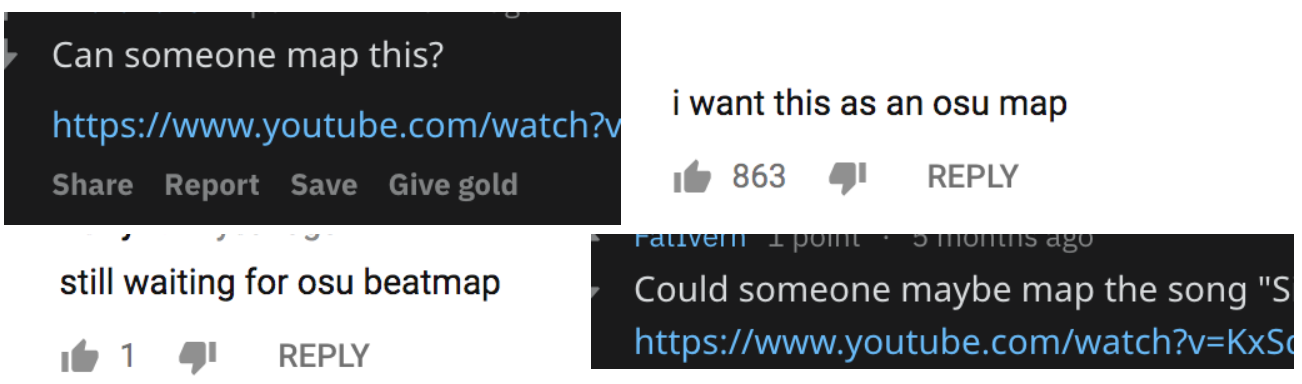
One of the cool things about Osu! is that all beatmaps are user-generated and free. The bad news is that creating them can be both challenging and tedious. Some "Mapping" tutorial series on YouTube consist of hours (!!) of content, not to mention the in-game beatmap editor can be a bit intimidating. The ubiquity of requests like these therefore come as little surprise:
So, I built a map generator that utilizes deep learning to generate a beatmap for any song. The generator only requires 3 user inputs: a song name, a BPM, and an audio file.
Here are a couple beatmaps the generator created without any other human input (no songs are from training data):
With the help of Tensorflow JS, I was able to make the generator available to anyone as a standalone web app. Try it for yourself at aisu.sh! You can also generate beatmaps from the command line by cloning the project repo.
How it Works
The beatmap generator can be broken down into the following high-level steps:

The most critical step as far as the beatmap's playability is concerned lies in determining where in a song the circles and sliders should occur (I'll refer to these instances as hit events). This is a great machine learning problem since audio analysis is so complex and there's an abundance of training data available on the Osu! website.
Gathering Training Data
Beatmaps like the ones shown in the videos above are intially downloaded by players as .osz
archives
from the Osu! website. Each .osz archive contains the following:
- 1 or more human-readable .osu files (1 file per difficulty) which contain all data the game needs to render the map
- 1 mp3 file
- some other stuff that’s not relevant here (hit sound audio files, background image or video, etc)
Here's a small snippet from the .osu file for the beatmap shown in the first video.
Each line describes a unique hit event and all the information the game needs to render it.
This includes a timestamp and positioning data.
[HitObjects]
77,171,8733,6,0,B|144:108|144:108|212:108,2,160,0|0|2,0:0|0:0|0:0,0:0:0:0:
180,292,10139,1,0,0:0:0:0:
248,332,10374,1,0,0:0:0:0:
328,332,10608,2,0,P|365:266|321:206,1,160,2|0,0:0|0:0,0:0:0:0:
216,80,11546,2,0,P|172:141|211:207,1,160,2|0,0:0|0:0,0:0:0:0:
292,196,12249,5,0,0:0:0:0:
292,196,12483,2,0,P|331:190|363:167,1,80,2|0,0:0|0:0,0:0:0:0:
392,92,12952,2,0,P|386:52|360:16,1,80,2|0,0:0|0:0,0:0:0:0
Official documentation for the .osu file format can be found here
Every week since 2012, the Osu! staff has posted a list of approved beatmaps from that week on the game's website.
I built a crawler that used these posts as a reference and downloaded nearly 30,000 beatmaps for over 7,000 different songs (25GB all together!). I deserialized each file and stored the contents as structured documents in a Mongo DB. After exploring the data a bit, I decided to only use beatmaps for training if they:
- Weren't corrupted in any way
- Had been favorited on the Osu! website at least 250 times
- Had at least 2 difficulty modes: medium (2.6-3.2 stars) and hard (3.2-5 stars)
These filters narrowed the training data down to 864 songs, each with 2 beatmaps (medium and hard).
Audio Preprocessing: Building Spectrograms
The next step is to preprocess the audio data and build a set of samples with which to train and validate the model.
There's too much data in a raw audio signal to practically train a neural network on. Additonally, much of that data consists of noise that is inaudible to humans. The goal is therefore to obtain a representation of the audio that is smaller and better matches human perception. Both of these goals can be achieved by using scaled spectrograms.
A spectrum is the distribution of amplitudes across the frequencies that make up the audio signal. It looks like this:

The change in an audio signal's frequency components over time can be examined by grouping the audio into frames, computing spectra for these frames, and then lining them up sequentially. The result is called a spectrogram, seen here:

The problem with the above spectrogram is that the power distribution is spread over a linear range of frequencies. In reality, human sound perception more closely resembles a logarithmic scale. To better represent what Osu! mappers hear, each spectrogram is run through a mel-scaled filter that groups the frequency power distribution into buckets that more closely resemble human hearing.
Here's the spectrogram from above but now filtered into 40 mel buckets:

Preprocessing the audio follows the same steps. Audio files in the dataset are loaded as floating point arrays (the signal) and then transformed into mel-scaled spectrograms (numpy matricies) of shape (?, 40) where ? represents the length of the song in frames.
Building Training Samples
Each spectrogram matrix is further broken down into overlapping samples of shape (69, 40), one sample for each frame in the song. These 69 frames represent approximately 800 mls of audio. The model will learn to label the middle frame of each sample (i=35) into of the following classes, using the outer 68 frames for context:
[1, 0, 0, 0]no hit event[0, 1, 0, 0]hit event takes place at medium difficulty[0, 0, 1, 0]hit event takes place at hard difficulty[0, 0, 0, 1]hit event takes place at both difficulties
To provide the model with some awareness of its recent predictions, I append a 41st row to each sample that describes the model outputs for the previous 35 frames (zero-padded to fill the sample width). This brings the final model inputs shape to (69, 41).
To achieve a well-balanced distribution of training data, I group the samples across the entire dataset based on the labels they correspond to, and then further into subgroups that correspond to the activity encoded in their "context rows" (row 41). You can see the exact logic here. Finally I take a random selection of equal numbers of samples from each group/subgroup, standardize the selected data (0 mean and unit variance), and train using a 80-20 train-validation split.
Convnet Architecture
For this section I'll assume a basic understanding of convolutional neural networks (ConvNets). If you'd like to learn about those, I found these lecture videos/notes to be a great resource while working on this project.
I used keras for training/debugging. Tensorflow JS is used for inference on the front-end.
The CNN architecture is as follows:

I use RELU activations for all the convolutions with padding applied so that feature maps retain the same dimensions as their inputs. Max pooling layers follow up each convolution to reduce overfitting and dimensionality. To further decrease overfitting, I added drop out (0.5) after the final fully connected layer. Softmax activation is used for final output for multiclass estimation.
I used categorical cross-entropy for the loss function, but I'm interested to see if a custom loss that weights miscalculations differently depending on "closeness" (predicting "hard" when the answer is "medium" is less wrong than if the answer were "no-hit") would do better or worse. SGD was used for optimization with the following hyper parameters:
- Momentum: 0.9
- Decay: 1e-6
- Learning Rate: 1e-2
Here's the training results over 25 epochs (1-2 hours of training on my PC's GeForce GTX 960):
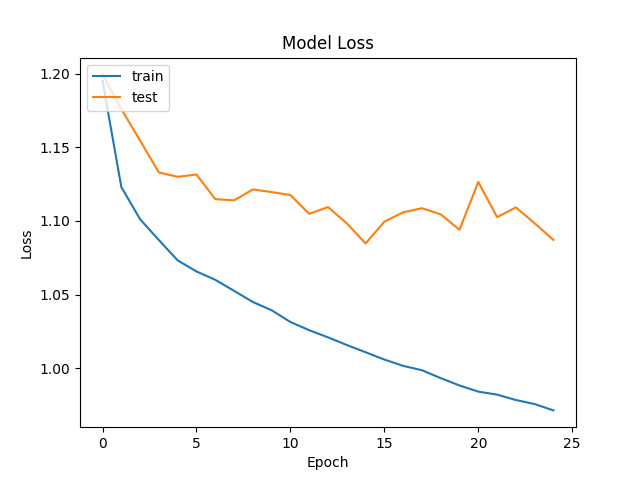
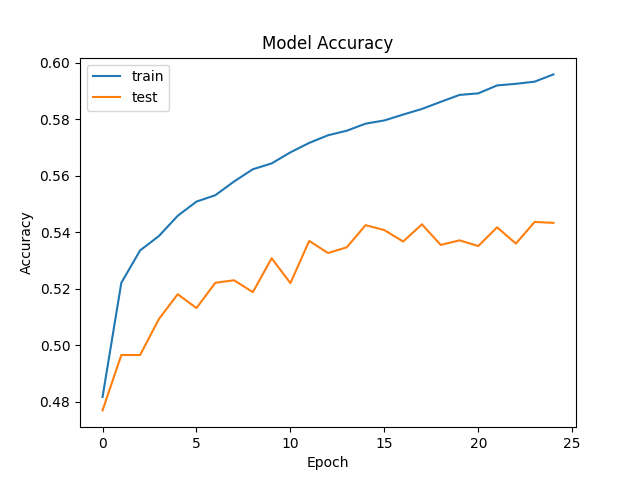
My best training session maxed out at about 55% accuracy on the validation set. This was lower than I'd hoped, but in practice it's enough to generate playable beatmaps. My guess is that one flaw might lie in structuring beatmap generation as a classification problem to begin with. Unlike popular classification problems like ILSVRC, there are no two humans that would listen to a song and produce the same beatmap. Therefore, even though the model is ostensbily "wrong" in its predictions about half the time, it has still acquired a near-human ability to time hit events after an hour or two of training.
From "Hit Events" to Circles and Sliders
Once the model is trained, the flow is as follows: the user inputs their song and the generator splits it into overlapping 800mls chunks of audio, represented as mel-scaled spectrograms. Each chunk (sample) is passed sequentially through the convnet which assigns one of the 4 labels to the sample's middle frame. The model labels are decoded into decimal numbers and gathed in a 1-D array. We now have a single "hit vector" that describes the hit events for every frame of the song's audio.
The goal from here is to now take that hit vector and "decode" it back into Osu! hit objects (circles and sliders) for each difficulty and then position those objects on screen in a playable configuration.
The first step is to transform the hit vector into into 2 separate 1-Hot arrays for medium and hard difficulties, since these are the in-game difficulties the beatmaps will be generated for.

Each 1-Hot array is broken down into a sequence of ~2 second long "sections". Each "section" is then translated into 1 or more hit objects (circles or sliders) based off a few hardcoded rules like number of hit events in section and the proximity of those objects to one another. The exact rules for this step can be found here.

Generating On-Screen Positions
The final step before the data can be written to .osu files is to generate positions for
each of the predicted hit objects.
I found the visual flow of Osu beatmaps to all follow a similar high-level pattern: sweeping movements from one area of the screen to another, with small flourishes and deviations along the way.
I decided to split the positioning model into 2 steps that mirror this flow:
- Use a markov chain built from training data to generate list of areas the song will "flow" through.
- Draw curvy paths between these areas, using random offsets between areas as control points.
Building the "Area" Markov Chain
To create the markov chain, I first split the gameplay screen into a 5x2 grid (10 areas). I generate a list
of on-screen coordinates
a beatmap flows through (its path) at every frame for each .osu file in the training set. I
translate
these coordinates into areas on the 5x2 grid and then sample the current area once per second for each
beatmap.
With each sample, I update a dictionary mapping the last 2 areas a path flowed through to its destination
area.
When the time comes to generate positions for hit objects, I randomly query the values in the dictionary for a given key (the last 2 areas the past hit objects have flowed through). This provides a semi-random area for the hit objects to "flow" towards over the next second, based on the flow patterns of existing beatmaps.
To get exact hit object coordinates, I use random offsets to create semi-circle paths
between the areas yielded by the markov chain, I use the resulting path coordinates to encode the hit object
positions when writing the .osu files. The full logic for positiong and writing the
playable .osz archive is contained in this git
submodule.
Conclusion
This was my first machine learning project and I definitely learned a lot from it. As for next steps, I'm most interested in expanding the model to generate more beatmap difficulties and to investigate replacing the existing positioning model with an RNN. Needless to say, I'm sold on deep learning, and thus, on our future AI overlords 🤖 Until such a cyber-political shift occurs however, I'll be blissfully clicking circles and sliding sliders, and now with an endless supply of beatmaps!
All the code to run this project locally (training + inference w/ keras) and generate beatmaps from the command line can be found here. Thanks for reading!